Epigenomics Analysis Platform
EpiNexus is a web platform for analysing epigenomic sequencing data — ChIP-seq, CUT&Tag, CUT&RUN, ATAC-seq and DNA methylation. Run publication-ready analyses, from raw reads to super-enhancer maps, without writing a single line of code: upload your files, click run, get results.
1
Upload Your Data
Drag and drop your FASTQ or BAM files in the browser, or import public data straight from GEO, SRA or ENA.
- ChIP-seq, CUT&Tag, CUT&RUN, ATAC-seq, DNA methylation
- FASTQ.gz, or BAM with its peak files
- Choose your reference genome
2
Click Run
EpiNexus runs a full pipeline — QC, mapping, peak calling, annotation, differential analysis, and more.
- Quality control & read mapping
- Peak calling & annotation
- Differential & super-enhancers
3
Explore Results
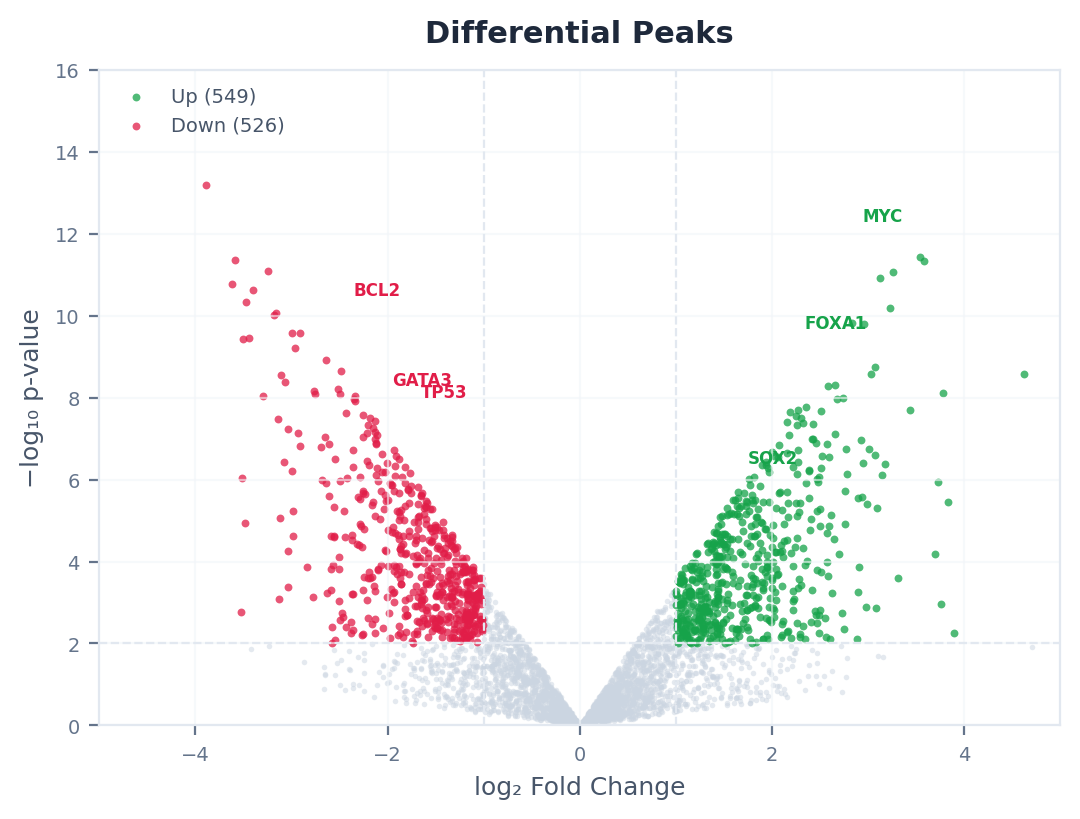
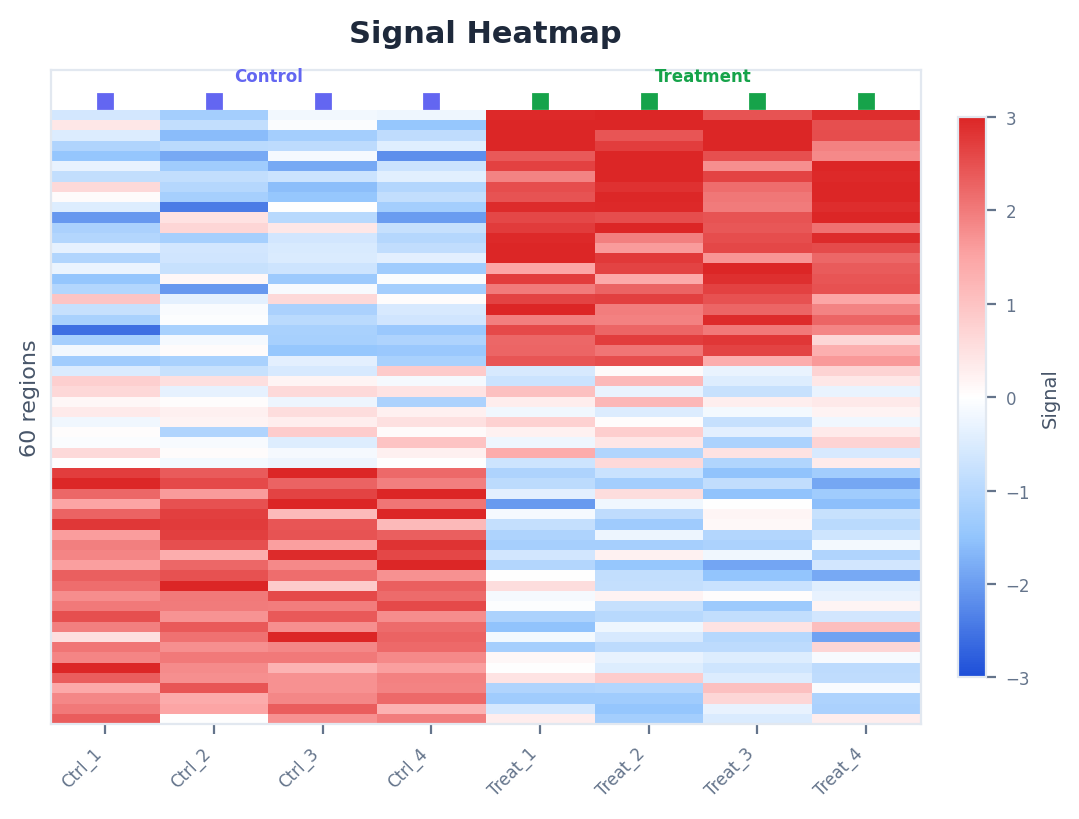
Interactive volcano plots, heatmaps, super-enhancer rankings — ready for your paper.